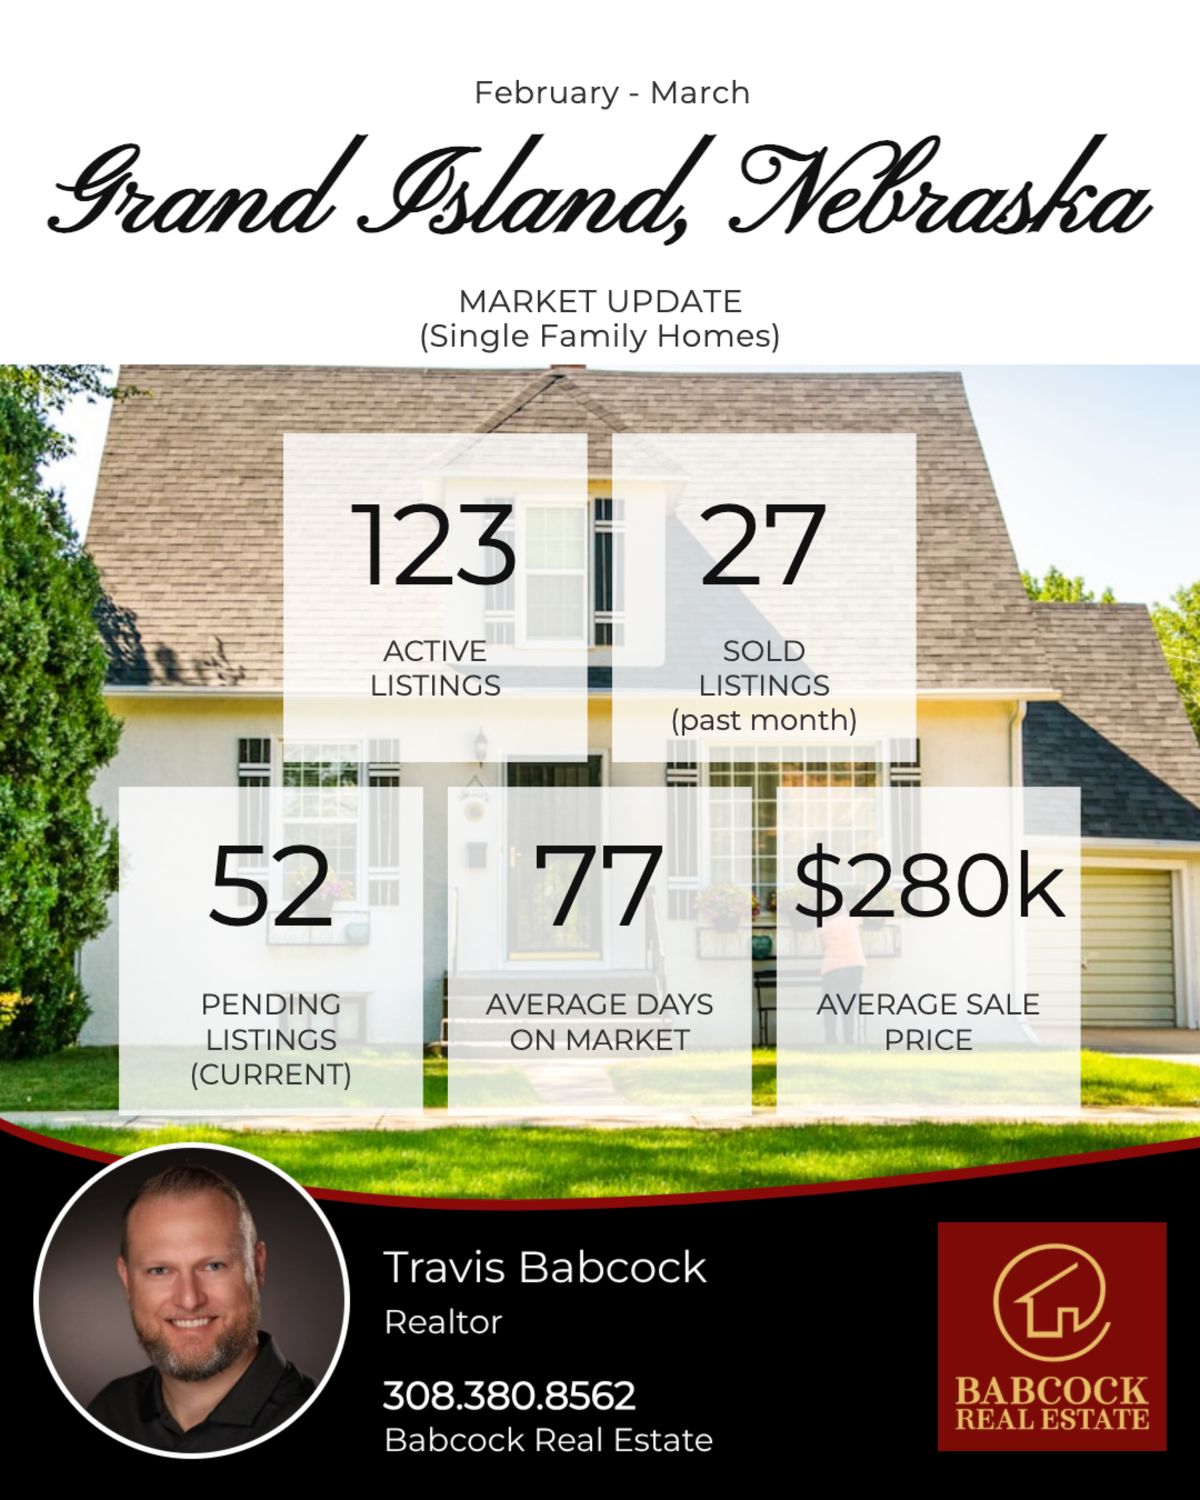
Grand Island Residential Market — September 2026
The Grand Island market is best described as stable overall, with some signs of cooling buyer activity but no meaningful deterioration in overall market balance.
Active inventory increased slightly in September, pending listings declined for the third consecutive month, and monthly closings fell. At the same time, the trailing six-month sales pace increased, overall months of inventory remained almost unchanged, and the sale-to-list ratio improved again.
That combination matters. Buyers appear somewhat less urgent, but the market has not yet shifted into materially higher inventory conditions.
| Metric | August | September | Change |
|---|---|---|---|
| Active Listings | 135 | 137 | +1.5% |
| Pending Listings | 52 | 47 | -9.6% |
| Sold — Current Month | 45 | 35 | -22.2% |
| Sold — Past 6 Months | 262 | 267 | +1.9% |
| Months of Inventory | 3.09 | 3.07 | Essentially flat |
| Absorption Rate | 32.34% | 32.48% | Essentially flat |
| Avg. Sale Price | $317,473 | $282,790 | -10.9% |
| Median Sale Price | $295,500 | $255,000 | -13.7% |
| Avg. DOM — Sold Listings | 63 | 33 | -30 days |
| Sale/List Ratio | 96.03% | 96.53% | +0.50 pts |
Previous-quarter comparison
A true calendar-quarter comparison is not yet possible because the workbook does not contain complete April and May data. I would not manufacture a Q2-vs-Q3 comparison.
As a useful substitute, compared with the June–August three-month baseline, September had:
- About 11% more active inventory
- About 23% fewer pending listings
- About 30% fewer monthly closings
- Roughly the same overall MOI and absorption rate
- A higher sale/list ratio
- Significantly shorter DOM among homes that actually sold
Key Direction
Stable overall, but becoming more selective.
The decline in pendings deserves attention. However, approximately 3.1 months of inventory and 32.5% absorption indicate that overall supply-demand balance has barely moved.